Cohort demographics
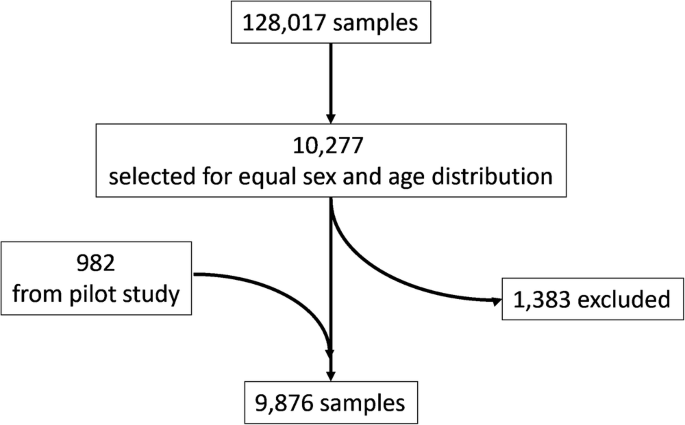
Demographics of the 9876 cohort participants are described in Table 3. In alignment with the sample selection algorithm, similar numbers were achieved in the age- and sex-stratified groups. BMI and smoking reflected previous findings in Danish blood donors20. The age distribution of smokers is shown in Supplementary Table 2. The distribution of participants across Danish administrative regions reflected inclusions in the DBDS cohort. The median number of prior donations at the date of the sample, including plasma donations, was 17 (IQR 7–32). In total, 602 participants had missing BMI or smoking information. Only few participants were underweight (59 participants, 0.006%), and these were therefore excluded from the BMI analysis. The number of measurements from participants with questionnaire information available for adjusted analysis is shown in Supplementary Data 1.
Biomarker measurements
In the present study we aimed to provide reliable and comparable concentrations for a wide range of inflammatory and vascular stress biomarkers across sex, age, smoking, and BMI. The heatmaps and the radar charts (Figs. 2–7) provide a quick impression of the biomarker profile differences according to the examined traits, whereas those with a need for more detailed information may consult the more detailed Supplementary Tables 3–49 with further information on individual biomarkers and their associations with demographics and lifestyle factors. For mean and standard deviation in each age group, we refer to Supplementary Data 5.
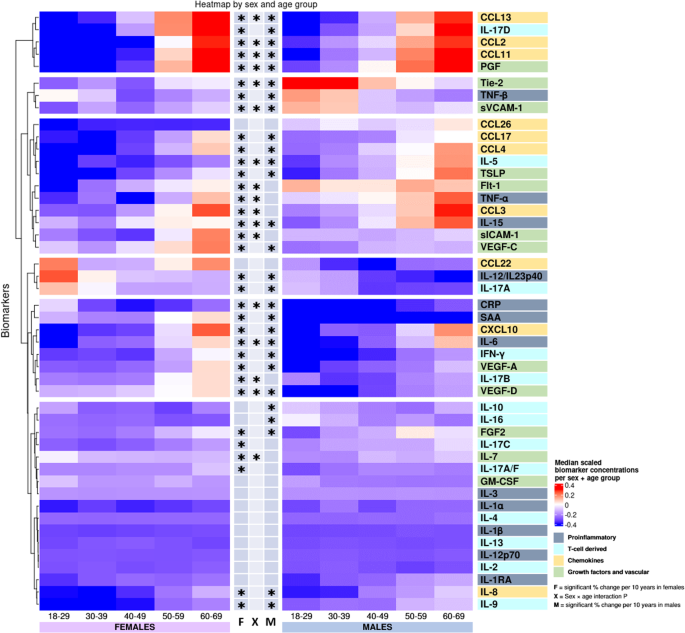
Biomarker labels are color-coded based on their grouping. Biomarkers are clustered by change with age. *Indicates significant change with age in females (F), males (M), or significant interaction between age and sex (X) derived from the linear models in the Supplementary Tables 3–49 using log-transformed concentrations and adjusted for smoking, BMI, region, sample storage time and measurement date, as relevant.
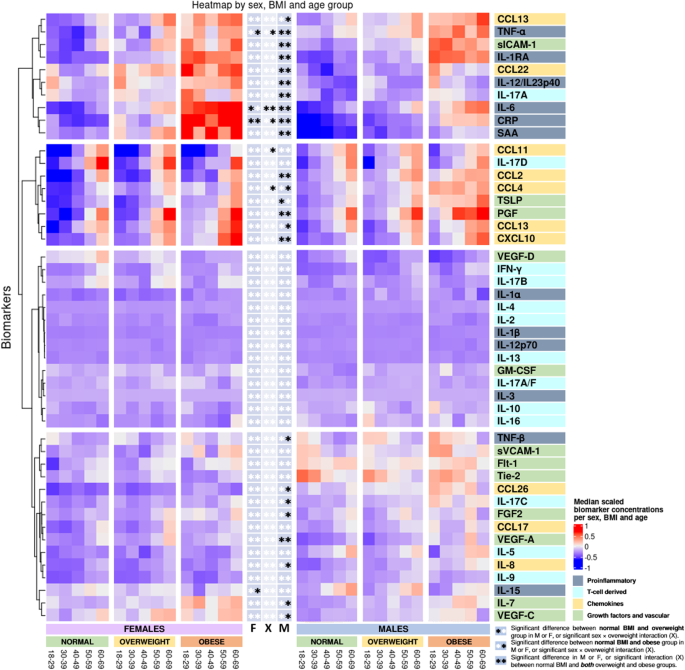
Biomarkers are clustered by change with BMI group. *Indicates significant change in biomarker concentrations between normal BMI group and either the overweight group (star to the left) or the obese group (star to the right) in females (F), males (M), or significant interaction between BMI group and sex (X) derived from the linear models in the Supplementary Tables 3–49. **Indicates a significant change in biomarker concentrations between the normal BMI group and the overweight group, and additionally between the normal group and the obese group. Linear regressions were performed using log-transformed concentrations and adjusted for sex, age, smoking, region, sample storage time, and measurement date.
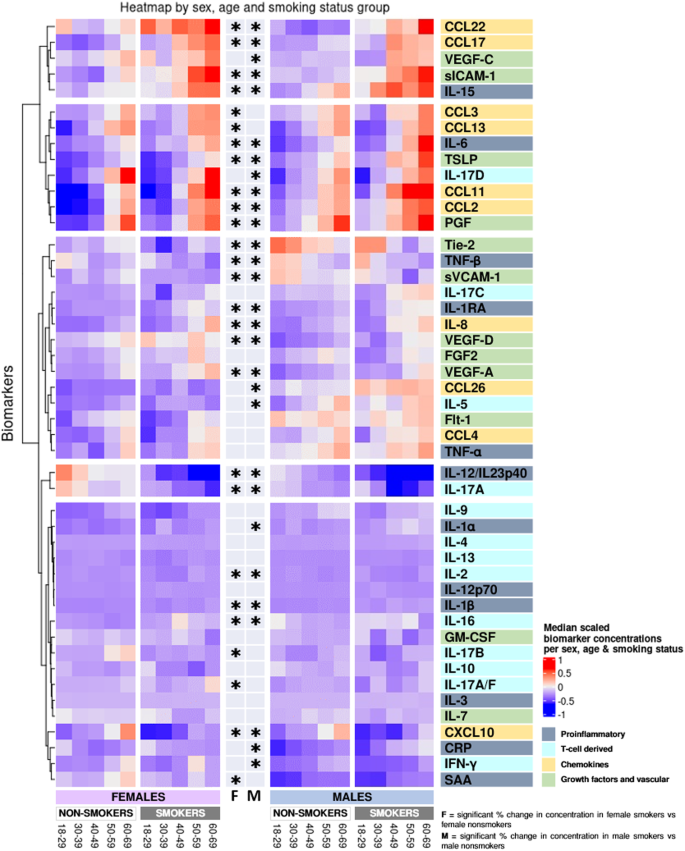
Biomarkers are clustered by change with smoking. *Indicate significant change with smoking in females (F), males (M) derived from the linear models in Supplementary Tables 3–49 where log-transformed concentrations were used, adjusted for age, BMI, region, sample storage time, and measurement date.
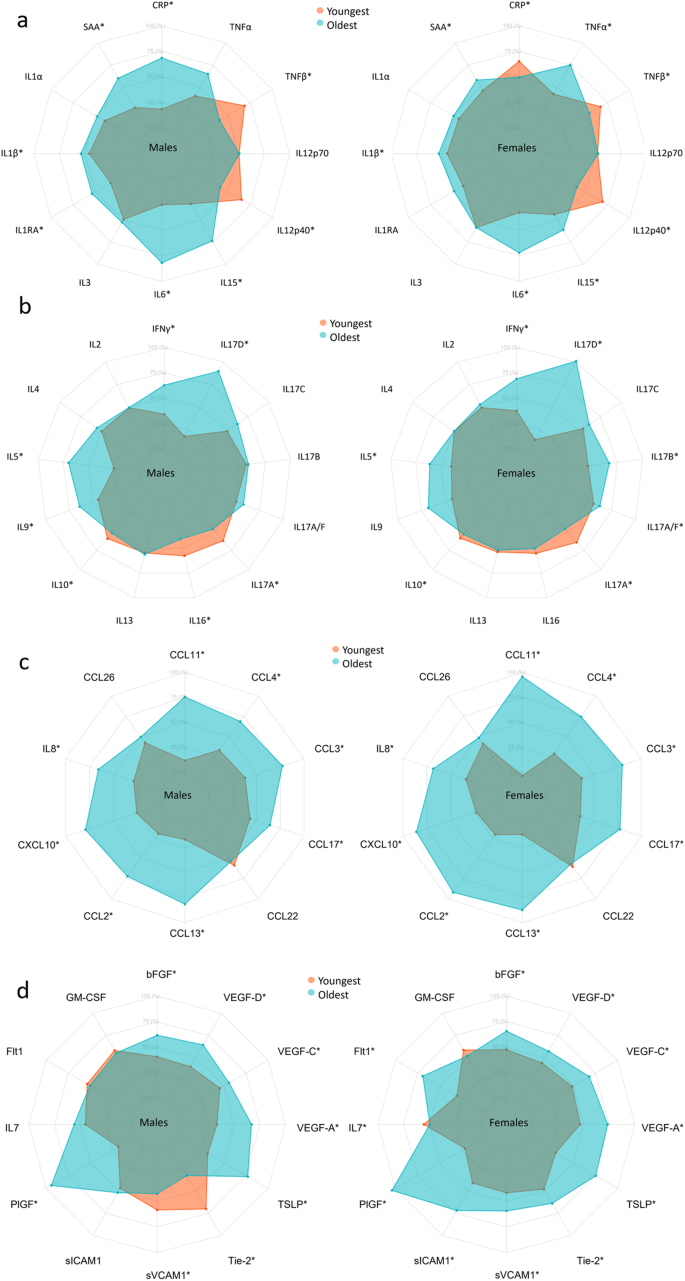
Axis percentage spans from the first to the third quartile within each marker. a is proinflammatory group, b is T cell-derived group, c is chemokine group, and d is growth factors and vascular group. * marks confidence intervals not spanning 0 for the effect of a 10-year increase in age.
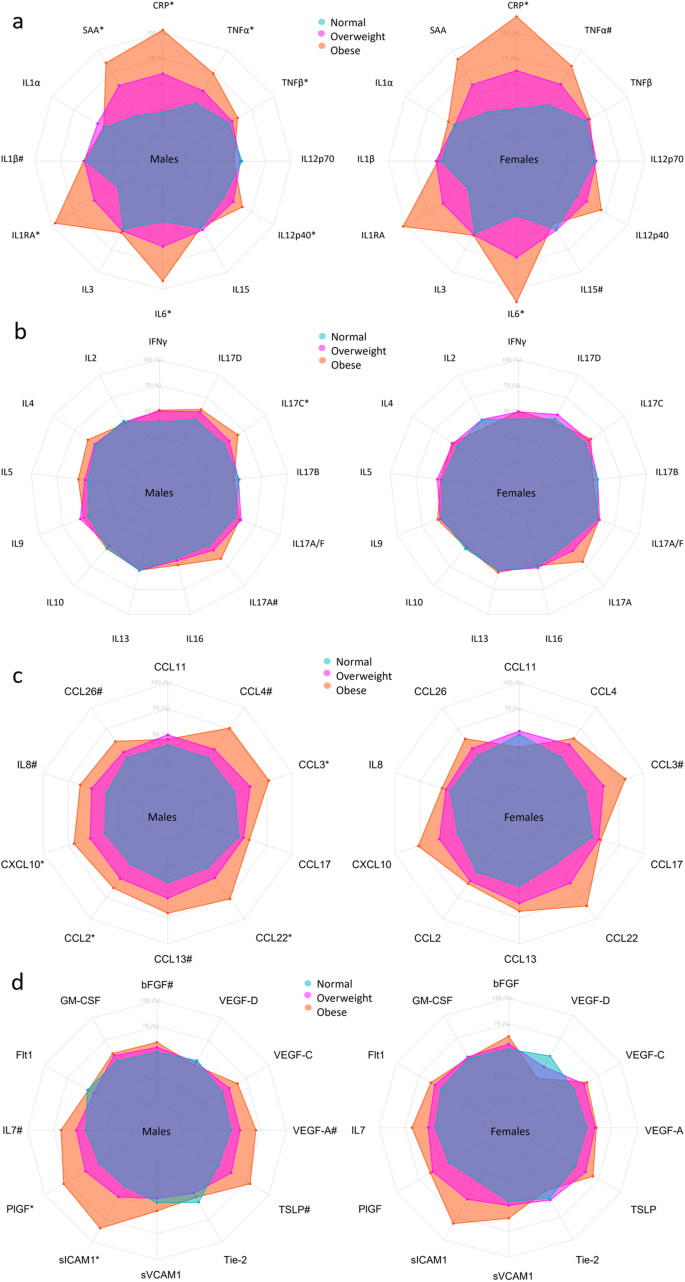
Axis percentage spans from the first to the third quartile within each biomarker. Normal BMI in blue, overweight BMI in magenta, obese BMI in red/orange. a is proinflammatory group, b is T cell-derived group, c is chemokine group, and d is growth factors and vascular group. * marks confidence intervals not spanning 0 for the difference between overweight and obese compared to normal, # marks the same for just one group.
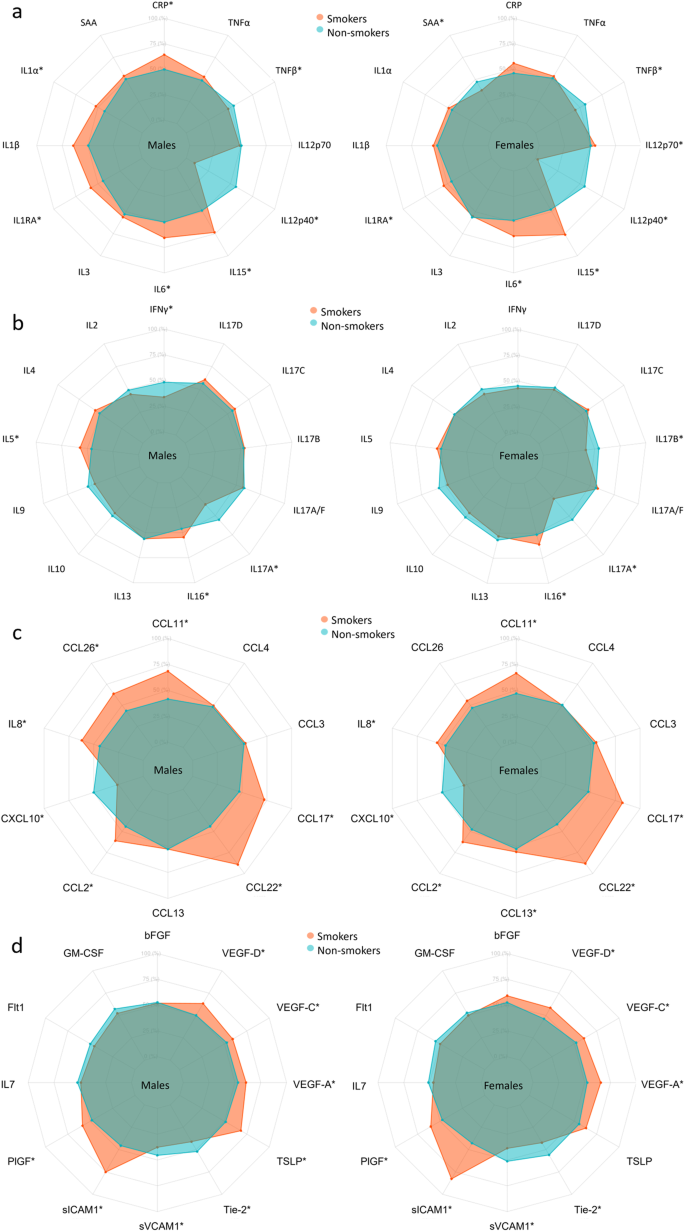
Axis percentage spans from the first to the third quartile within each biomarker. a is proinflammatory group, b is T cell-derived group, c is chemokine group, and d is growth factors and vascular group. * marks a statistically significant difference between smokers and non-smokers.
Available measurements
Only few measurements were above the upper limit of detection (16 SAA measurements and 12 measurements distributed across bFGF, IL-16, VEGF-A, CCL26, CXCL10, CCL17, and IL-1RA). For the biomarkers IL-3, IL-1B, IL-13, IL-12p70, IL-4, IL-2, IL-9, IL-17A/F, IL-17C, TSLP, and GM-CSF (ordered by % below detection range), more than 10% were below detection range (see supplementary Data 1).
Prior donations, regional differences, and sample age
There were 13 biomarkers significantly associated with sample age (Supplementary Data 2), and sample age was consequently included as an adjustment in subsequent models. We examined the effect of prior donations (all types) within three years and only found an effect for IL-15 and IL-7 and did not pursue this further (Supplementary Data 3). Concentrations of several markers differed between regions (Supplementary Data 4), and thus region was included as an adjustment in all other models.
Association between sex and age and biomarker concentrations
Proinflammatory biomarkers
Most proinflammatory biomarker concentrations differed between sexes (CRP, SAA, IL-6, and IL-12/IL-23p40 concentrations were higher in females; TNF-α and TNF-β levels were higher in males), with IL-6 and IL-15 having a greater increase with age in males, as presented for the interaction term in Fig. 2 and in Supplementary Tables 3–14 found at the end of the supplementary information containing various regression results for each biomarker. Several proinflammatory biomarkers increased with age (SAA, IL-6, and IL-15) and were thus higher in older participants of both sexes (Figs. 2, 5a). TNF-β and IL-12/IL-23P40 decreased with age in both sexes. CRP increased with age in males and TNF-α increased with age in females. CRP was highest in young females, and lowest in 40–49-year-old females, whereafter concentrations increased with age (Supplementary Fig. 8).
T cell-derived biomarkers
Among T cell-derived biomarkers, IL-16 differed between sexes, and sex-specific age effects for IL-5 and IL-17B (Fig. 2 and Supplementary Tables 18, 22, 25) was observed. IFN-γ, IL-5, IL-9, and IL-17D increased with age in both sexes, with a greater IL-5 increase in males. IL-17A decreased with age in both sexes. IL-17A/F and IL-17B increased with age in females. IL-10 and IL-16 decreased with age in males.
Chemokine biomarkers
Most chemokines differed between sexes (CCL2, 4, 11, 13, 17, and 26, CXCL10, and IL-8 were higher in male participants, whereas CCL22 was higher in females), with a greater increase with age in females than in men for CCL11, CCL2, CCL13, and CXCL10 (Fig. 2 and Supplementary Tables 28–37). All chemokine concentrations increased with age, except CCL26, which remained unchanged (Figs. 2, 5c).
Growth factors and vascular biomarkers
Several growth factors and vascular biomarkers differed between sexes (Flt-1, PlGF, sICAM-1, sVCAM-1, and Tie-2 higher in males. IL-7 and VEGF-D higher in females) with a greater Flt-1 and PlGF increase with age in females and a VEGF-D increase in males (Fig. 2 and Supplementary Tables 38–49). Furthermore, bFGF, PlGF, TSLP, VEGF-A, VEGF-C, and VEGF-D increased with age in both sexes. Flt-1, Tie-2, sICAM-1, and sVCAM-1 increased with age in females, whereas Tie-2 and sVCAM-1 decreased with age in males. IL-7 decreased with age in females (Figs. 2, 5d).
In Fig. 2, clusters of biomarkers appeared to display distinct patterns across sex and age, with the proinflammatory, T cell-derived, and growth factor and vascular biomarkers generally clustering away from the chemokine cluster. As an exception, IL-8 clustered with proinflammatory and T cell-derived biomarkers. To examine the possible effects of menopause, we compared females aged 50 or more to those aged below 50 and found most chemokines to be increased after age 50 while only some proinflammatory, T cell-derived, and growth factors and vascular biomarkers showed differences (Supplementary Data 6).
Association between BMI and biomarkers
Proinflammatory biomarkers
Comparing participants with a normal BMI with obese participants, CRP, IL-6, and TNF-α displayed a greater increase in females, as shown by the interaction terms in Fig. 3 and in Supplementary Tables 3, 8, and 13. Compared with the normal BMI group, CRP, and IL-6 concentrations increased with BMI group in both sexes; SAA, IL-1RA, IL-12/IL-23p40, TNF-α, and TNF-β increased with BMI group in male participants (Figs. 3, 6a and Supplementary Tables 3–14). TNF-α was increased and IL-15 was decreased in obese females.
T cell-derived biomarkers
IL-17A tended to increase with BMI group in males and IL-17C was increased in overweight males (Figs. 3, 6b and Supplementary Tables 23, 26).
Chemokine biomarkers
The effect of obesity on concentrations of CCL11 and CCL4 was greater in males (see interaction terms in Fig. 3 and Supplementary Tables 30, 31). CCL2, CCL3, CCL22, and CXCL10 increased with BMI group in males; IL-8, CCL4, CCL13, and CCL26 were higher in obese males only; CCL3 was increased in obese females (Figs. 3, 6c and the Supplementary Tables 28–37).
Growth factors and vascular biomarkers
Although no association was found with BMI for VEGF-D, the effect of BMI on concentrations of VEGF-D differed between males and females, as displayed by the interaction terms in Supplementary Table 49. PlGF, sICAM-1, and VEGF-A increased with BMI group in males, and bFGF, IL-7, TLSP, and VEGF-C were increased in obese males (Figs. 3, 6d and Supplementary Tables 38–49).
In Fig. 3, it appears that clusters of biomarkers displayed distinct patterns across sex, age, and BMI group, with several proinflammatory and T cell biomarkers clustering together and the chemokine cluster, the growth factor, and the vascular biomarker cluster being distinct. Analysis of BMI as a continuous variable stratified by age group and sex generally reflected the analysis of BMI groups, although additional significant associations were observed in females (supplementary Data 7) compared to analysis using BMI groups (Supplementary Tables S3–S49). This was particularly true for assays in the chemokine and growth factor groups.
Association between smoking and biomarkers
Proinflammatory biomarkers
Compared with non-smokers, smokers’ concentrations of IL-1β, IL-1RA, IL-6, and IL-15 were higher in both sexes (Figs. 4, 7a and Supplementary Tables 3–14). CRP and IL-1α were higher in male smokers. IL-12/IL-23p40 and TNF-β concentrations were lower in both male and female smokers, and SAA was lower in female smokers.
T cell-derived biomarkers
Compared with non-smokers, smokers’ IL-2 and IL-17A concentrations were lower in both sexes (Figs. 4, 7b and Supplementary Tables 15–27). IL-16 concentrations increased with smoking in both sexes, whereas IL-5 and IL-17D increased with smoking in males and IL-17C increased in females. IFN-γ was lower in male smokers. IL-17A/F and IL-17B was lower in female smokers and with a sex-specific effect for IL-17B.
Chemokine biomarkers
Compared with non-smokers, smokers’ concentrations of CCL11, IL-8, CCL2, CCL22, and CCL17 were higher in both sexes, whereas CXCL10 was lower in smokers of both sexes (Figs. 4, 7c and Supplementary Tables 28–37). CCL26 was higher in male smokers, whereas CCL3 and CCL13 was higher in female smokers.
Growth factors and vascular biomarkers
Compared with non-smokers, smokers’ PlGF, sICAM-1, TLSP, VEGF-A, and VEGF-D concentrations were higher, whereas sVCAM-1 and Tie-2 tended to decrease with smoking in both sexes (Figs. 4, 7d and Supplementary Tables 38–49). VEGF-C was higher in male smokers.
In Fig. 4, clusters of biomarkers appear to be displayed in distinct patterns across sex, age, and smoking, with the proinflammatory and T cell-derived clustering together and chemokines and growth factor and vascular biomarkers clustering together. After adjusting for multiple comparisons, we found no statistically significant interaction between sex and smoking, despite observing that certain biomarkers (e.g., CCL13, CCL26, IL-1α, IL-5, IL-12p70, IL-17B, IFNγ, SAA, and CRP) were significantly correlated with smoking in only one sex.


