Study design
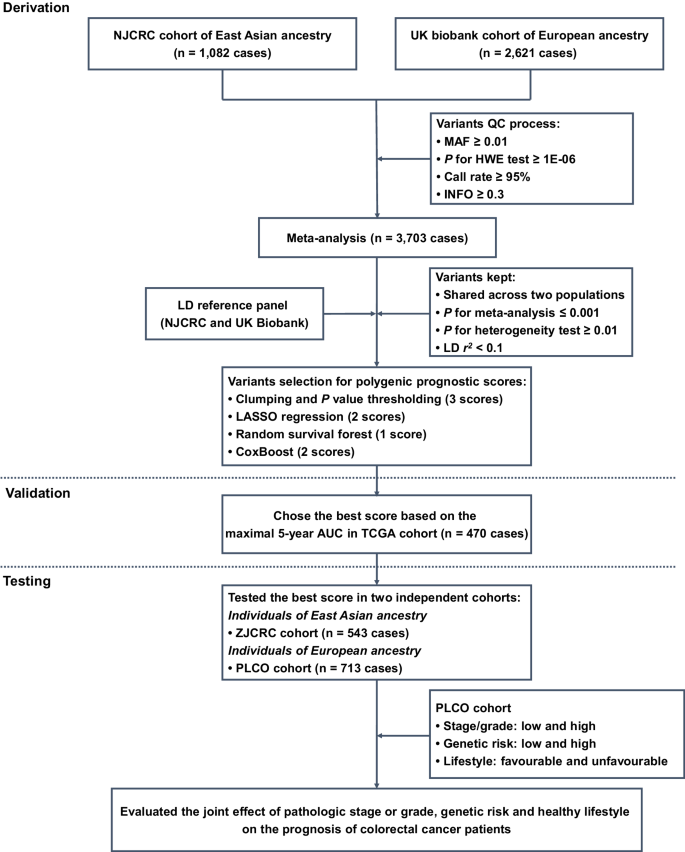
Here, a three-stage study design was applied (Fig. 1). In the first derivation stage, leveraging two independent colorectal cancer survival GWAS datasets (i.e., NJCRC and UK Biobank cohorts), we performed a meta-analysis to identify survival-associated genetic loci, as well as eight candidate PPSs with different approaches. In the second validation stage, we assessed the discriminatory accuracy of each PPS in an independent longitudinal cohort from The Cancer Genome Atlas (TCGA) to determine an optimal PPS framework for 5-year overall survival prediction. In the third testing stage, using the external ZJCRC cohort and Prostate, Lung, Colorectal and Ovarian (PLCO) cancer screening trial, we further estimated the efficacy of the optimal PPS in colorectal cancer survival prediction, and evaluated the joint effect of pathologic stage or grade, genetic risk and healthy lifestyle (Supplementary Table 1) on the prognosis of colorectal cancer patients.

QC quality control, MAF minor allele frequency, HWE Hardy-Weinberg Equilibrium, LD linkage disequilibrium, LASSO least absolute shrinkage and selection operator, TCGA The Cancer Genome Atlas, AUC area under the curve, PLCO Prostate, Lung, Colorectal and Ovarian Cancer Screening Trial.
Meta-analysis of colorectal cancer survival GWASs
In the derivation stage, leveraging the genetic and clinical data of colorectal cancer patients from NJCRC (1082 cases of EAS ancestry) and UK Biobank (2621 cases of EUR ancestry; Supplementary Fig. 1) cohorts (Table 1), we performed a meta-analysis to identify genetic variants associated with colorectal cancer overall survival (Supplementary Fig. 2A). No residual population stratification was observed (lambda = 1.027; Supplementary Fig. 2B).
Notably, we found two independent variants that were significantly associated with colorectal cancer overall survival beyond the suggestive genome-wide significance (PCox < 5 × 10⁻⁶), namely the rs10967103 [9p21.2; hazard ratio (HR)meta = 1.70, Pmeta = 4.05 × 10⁻⁶] and rs79067806 (12q12; HRmeta = 1.89, Pmeta = 4.14 × 10⁻⁶; Supplementary Table 2; Supplementary Fig. 2C, D). However, there were no SNP-gene expression associations reported in the Genotype-Tissue Expression (GTEx) project for rs10967103 and rs79067806. In addition, although these two SNPs were located nearby previously reported risk-related regions, they were not observed to be associated with the risk of colorectal cancer in a previous GWAS meta-analysis of case-control studies9 [35,145 cases and 288,934 controls; rs10967103: odds ratio (OR)meta = 1.02, Pmeta = 0.449; rs79067806: ORmeta = 1.00, Pmeta = 0.955; Supplementary Table 3].
Construction and validation of PPSs with multiple approaches
Subsequently, we aimed to construct and validate a solid PPS for colorectal cancer survival prediction. Among the eight candidate PPSs (Table 2), seven were significantly associated with an increased risk of all-cause death in the TCGA cohort (470 patients) of EUR ancestry, with HR per standard deviation (SD) increase ranging from 1.47 (P = 0.001) for the clumping and P value thresholding (i.e., C + T) method (parameter of P value: 1 × 10⁻⁴) to 1.99 (P = 1.76 × 10⁻⁸) for the random survival forest (RSF) method.
Notably, the RSF approach-based PPS that harbored 287 SNPs (defined as PPS287; Supplementary Data 1) achieved the optimal discriminatory ability for 5-year overall survival prediction, with a time-dependent area under the receiver operating characteristics (ROC) curve (AUC) of 0.652. We then divided the patients into high- and low-PPS groups, with the median score of PPS287 as a cut-off value. Compared to patients in the low-PPS group, those carried with high-PPS had shorter overall survival (log-rank P < 0.001) in the validation (i.e., TCGA cohort; Supplementary Fig. 3A) datasets. In addition, the calibration and time-dependent ROC curves of the PPS287 model showed good agreement between the predicted and observed 5-year survival probability (Supplementary Fig. 3B), as well as excellent performance in 5-year survival prediction (Supplementary Fig. 3C).
Testing the optimal PPS in external cohorts
We further evaluated the performance of PPS287, the optimal PPS, in two external cohorts, namely the ZJCRC cohort (543 patients of EAS ancestry) and PLCO cohort (713 patients of EUR ancestry). As expected, PPS287 was significantly associated with an increased risk of all-cause death in both the ZJCRC (HR per SD = 1.90, P = 3.21 × 10⁻¹⁴) and PLCO (HR per SD = 1.80, P = 1.11 × 10⁻⁹; Supplementary Table 4) cohorts. Similar associations were also found between PPS287 and 3-year or 5-year colorectal cancer overall survival. The AUCs at 5-year were 0.649 in the ZJCRC cohort and 0.658 in the PLCO cohort, which were similar with the predictive accuracy in the validation cohort (i.e., TCGA).
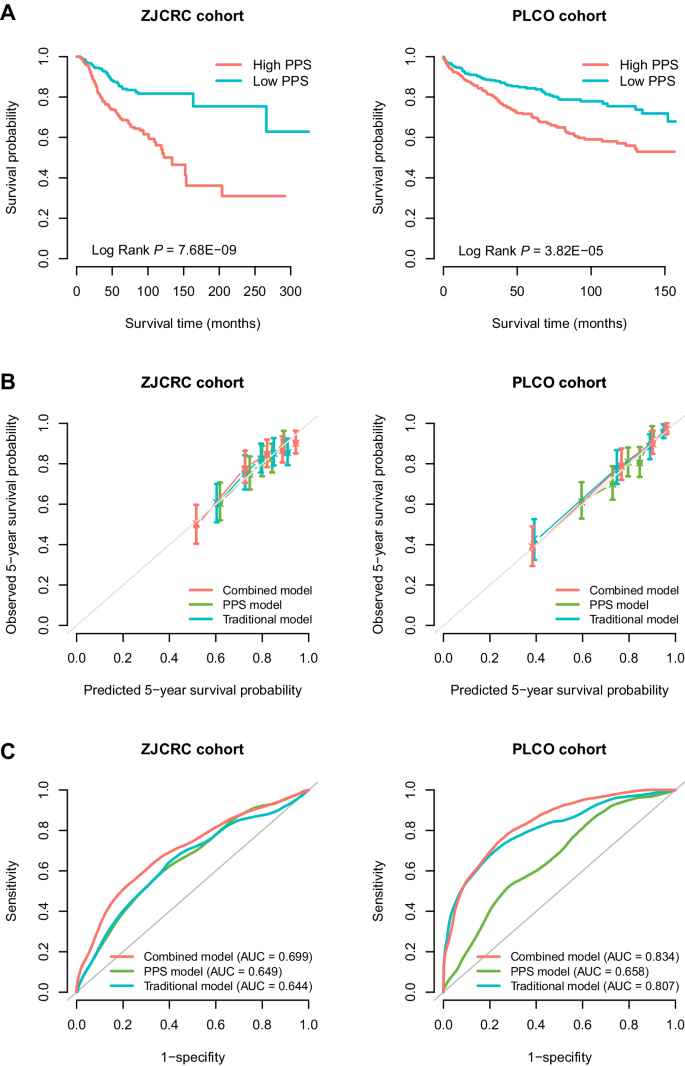
In addition, using the median score as a cut-off to divide the low- and high-PPS subgroups, patients in the high-PPS group had poorer overall survival than patients carried with low-PPS in the two cohorts (ZJCRC: log-rank P = 7.68 × 10⁻⁹; PLCO: log-rank P = 3.82 × 10⁻⁵; Fig. 2A). Interestingly, when stratified by clinical factors (e.g., sex, age, smoking status and drinking status), the high-PPS was still broadly and significantly associated with poorer prognosis in the two cohorts (HR > 1; Supplementary Fig. 4A, B). Similar results were also observed in the sensitivity analyses (Supplementary Table 5).

A Kaplan–Meier curves for overall survival probability stratified by different levels of PPS (based on median value) in the ZJCRC and PLCO cohorts. B Calibration curve of different prognostic models for predicting 5-year survival probability in the ZJCRC and PLCO cohorts. The vertical error bars denote the 95% CI. C Time-dependent ROC curves of different prognostic models regarding 5-year survival probability in the ZJCRC and PLCO cohorts. The traditional model included sex, age, smoking status and drinking status for the ZJCRC cohort; and sex, age, smoking status, drinking status, stage and grade for the PLCO cohort. The combined model included both traditional factors and PPS. The sample sizes of ZJCRC and PLCO cohorts are 543 and 713 cases. Note: PLCO Prostate, Lung, Colorectal and Ovarian Cancer Screening Trial, PPS polygenic prognostic score, ROC receiver operating characteristics, AUC area under the curve, 95% CI 95% confidence interval.
Additional benefits of PPS to the clinical prognostic model
In the ZJCRC and PLCO cohorts, several clinical factors associated with the overall survival of colorectal cancer were identified (Supplementary Tables 6 and 7), including age (ZJCRC: HR = 1.05, P = 8.33 × 10⁻¹⁰; PLCO: HR = 1.05, P = 5.21 × 10⁻⁵), stage (PLCO: HRtrend = 2.82, Ptrend = 4.69 × 10⁻³⁴) and grade (PLCO: HRtrend = 2.53, Ptrend = 2.48 × 10⁻¹¹). After adjusting for these clinical variables with a multivariate Cox regression analysis, higher PPS287 remained to be an independent prognostic factor for predicting overall survival (ZJCRC: HR = 3.24, P = 1.05 × 10⁻¹⁰; PLCO: HR = 2.25, P = 2.72 × 10⁻⁵) in the two cohorts.
To evaluate the additional prognostic value of PPS287 to the traditional clinical model, we constructed a combined Cox regression model by integrating PPS287 with several common clinical factors for each cohort (ZJCRC: sex, age, smoking status and drinking status; PLCO: sex, age, smoking status, drinking status, stage and grade). Compared to the traditional model, the calibration curve of the combined model showed better agreement between the predicted and observed 5-year overall survival (Fig. 2B).
In addition, the AUCs at 5-year overall survival prediction of the traditional prognostic model were 0.644 in the ZJCRC cohort and 0.807 in the PLCO cohort, while those of the combined model were 0.699 and 0.834, respectively (Fig. 2C), indicating that the predictive accuracy of the combined prognostic model was significantly higher than that of the PPS or traditional models alone in the two cohorts (PAUC < 0.01; Supplementary Table 8). Similar results were also observed using more evaluation metrics (e.g., Harrell’s C index and Royston and Sauerbrei’s R2D; Supplementary Table 9), as well as the decision curve analysis (DCA; Supplementary Fig. 5A, B), demonstrating the additional value of PPS in colorectal cancer survival prediction.
Joint effects of pathologic characteristics, genetic risk and healthy lifestyle on overall survival of colorectal cancer
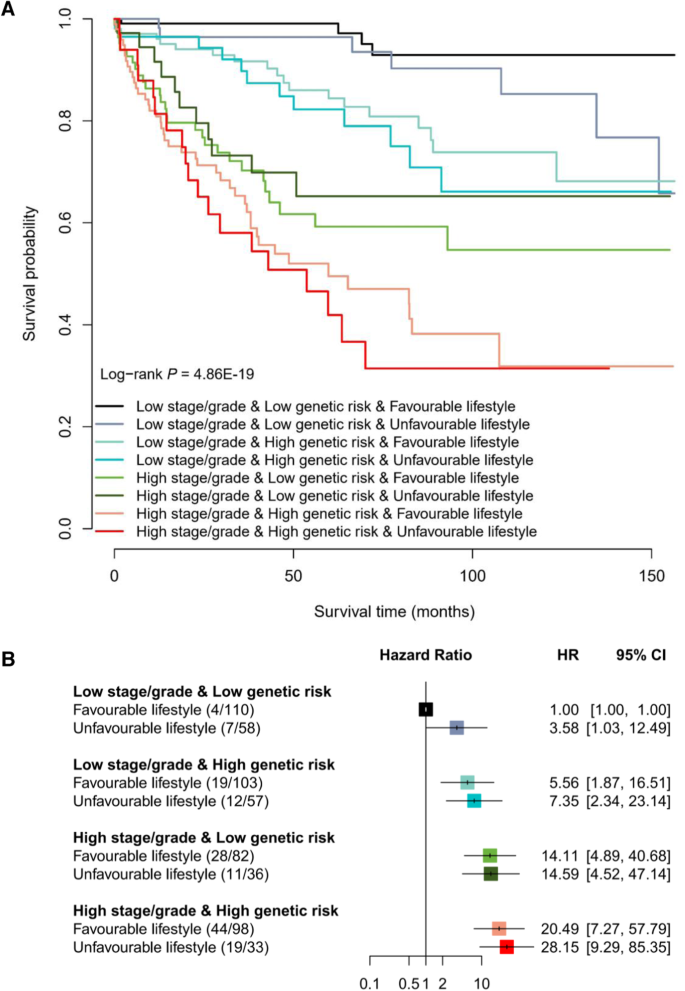
Subsequently, given that the PLCO cohort included sufficient lifestyle information, we calculated an integrated healthy lifestyle score and aimed to evaluate the joint effect of pathologic stage or grade, genetic risk and healthy lifestyle on the prognosis of colorectal cancer patients in the PLCO cohort (Supplementary Table 10). Broadly, there was a notable dose-response manner on decreasing overall survival probability in the pattern of higher stage/grade, higher genetic risk (higher PPS), and unfavorable lifestyle (lower lifestyle score) (log-rank P = 4.86 × 10⁻¹⁹; Fig. 3A), but no second-order multiplicative interaction between them was observed (Pinteraction = 0.145). In particular, patients with a high stage/grade, a high genetic risk and an unfavorable lifestyle had a 27-fold increased risk of death than those with a low stage/grade, a low genetic risk and a favorable lifestyle (HR = 28.15, P = 3.68 × 10⁻⁹; Fig. 3B).

A Kaplan–Meier curves for overall survival probability stratified by different levels of pathologic stage or grade, genetic risk and healthy lifestyle. B The association of pathologic stage or grade, genetic risk and healthy lifestyle with overall survival of colorectal cancer patients. The HR and 95% CI were derived from the Cox regression model with the adjustment of sex, age, research center, arm and top 10 principal components. The number in the bracket indicates the number of deaths/number of all cases. The horizontal error bars denote the 95% CI. The sample size of PLCO cohort is 713 cases. Note: PLCO Prostate, Lung, Colorectal and Ovarian Cancer Screening Trial, HR hazard ratio, 95% CI 95% confidence interval.
Interestingly, when stratifying patients by the categories of stage/grade and genetic risk, although few significant associations were observed, patients with colorectal cancer who maintained a healthy lifestyle could experience a lower risk of death (HR < 1; Table 3) than those who followed an unfavorable lifestyle. Especially, among patients with a low stage/grade and a low genetic risk, the overall survival rate ranged from 65.78% (unfavorable lifestyle) to 92.90% (favorable lifestyle; P = 0.042). Notably, among patients with a high stage/grade and a high genetic risk, the 5-year overall survival rate of those with an unfavorable lifestyle decreased to 41.9%, which could be increased to 49.52% among those with a favorable lifestyle (difference = 7.62%).
Clinical application of the integrated prognostic model
To further apply the integrated model including clinical stage/grade, PPS287 and healthy lifestyle score in clinical practice, we developed a ColoRectal Cancer Survival Prediction System (CRC-SPS, http://njmu-edu.cn:3838/CRC-SPS/), including (i) “Colorectal cancer survival summary statistics” and (ii) “Colorectal cancer survival prediction” modules. The “About” page provides more details about the functions of this web server.
On the “Colorectal cancer survival summary statistics” page, when users enter a batch of SNP IDs, or enter a genetic region, a table [with chromosome ID, SNP ID, SNP genomic position, SNP alleles (A1: effect allele; A2: reference allele), effect allele frequency (EAF), beta, standard error (SE) in NJCRC and UK Biobank cohorts, and corresponding associations of meta-analysis] will be built. Users can download the results by clicking the “Download” button. Besides, users can select one SNP-survival pair and click the ‘Plot’ button, the diagrams of Kaplan–Meier plot will be provided to display the associations among the two cohorts.
On the “Colorectal cancer survival prediction” page, CRC-SPS can help users estimate individual 5-year overall survival probability, with the PLCO cohort as a reference dataset. In brief, users can easily input their sex, age, lifestyle information (e.g., smoking status) and clinical characteristics (e.g., clinical stage) along with the genotypes of 287 SNPs to obtain an estimated 5-year survival probability. In addition, we provided the 5-year survival probability (i.e., 77.1%) in the PLCO cohort as a reference threshold, to stratify the population into subgroups with high and low risk of death. For example, the colorectal cancer patient with a predicted 65.8% of 5-year survival probability was grouped as having a high risk of death.


